
Retirement-Hack #1: Here’s Proof That Time Matters

Posted October 03, 2024
Davis Wilson
History shouldn’t always be used as a guide to the future.
However, studying the past can certainly provide a good baseline when forecasting a range of possible outcomes.
I recently found an interesting chart by Ben Carlson that can serve as a good stock market baseline.
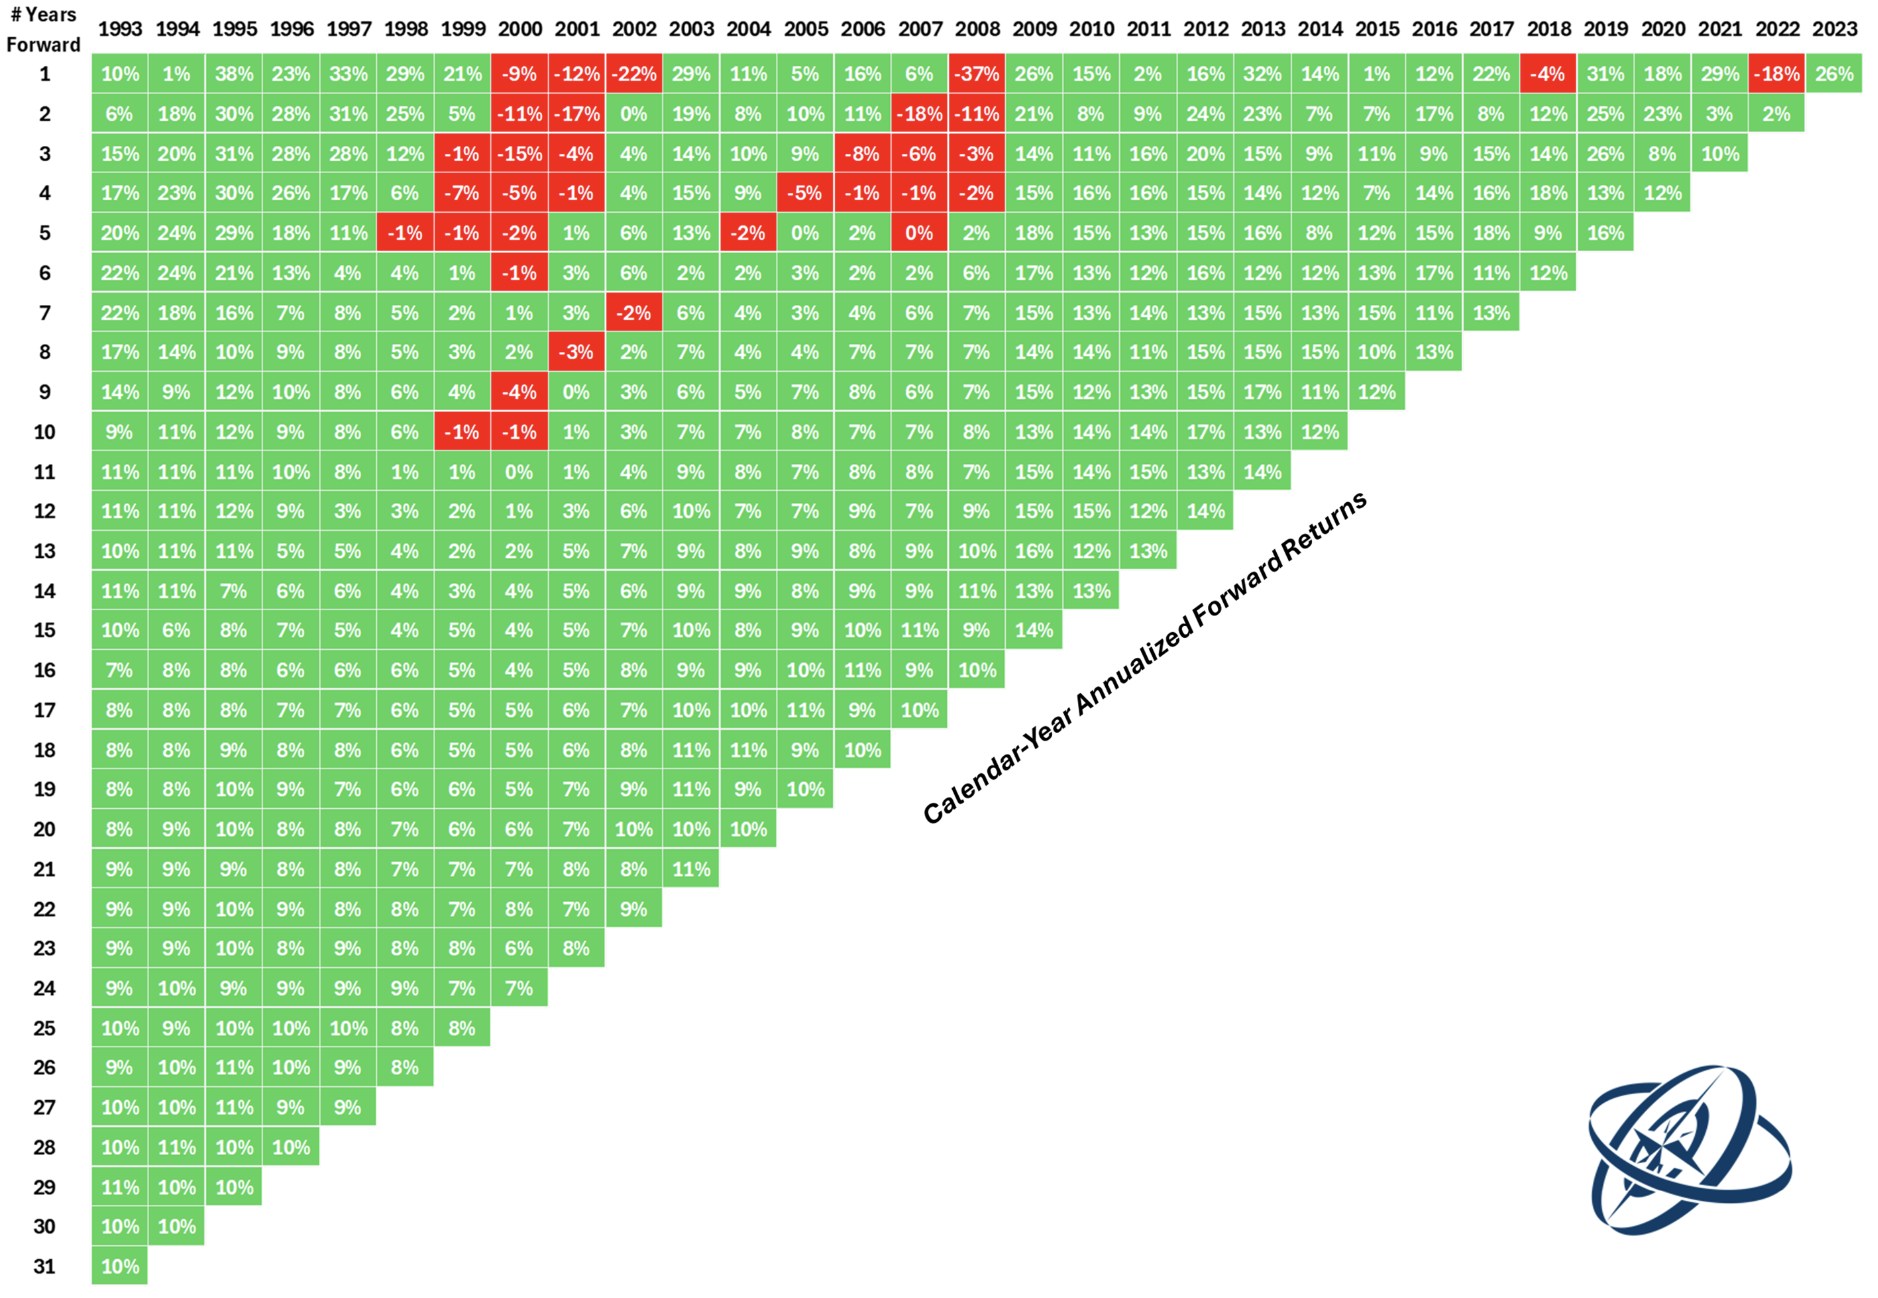
Here’s how to read this chart:
Pick any year across the top to start, then go down any number of years and the corresponding square will tell you the annualized return from that starting point.
For example, the 5-year annual return starting in 1993 was 20% per year.
There is plenty of green in this chart, indicating positive returns, as well as a few painful periods.
There are no losses going out 11 years or more. Meaning that if you kept your money invested for 11 years at any point over the last 30 years, you made money.
This is despite the Dot.Com bubble and the Great Financial Crisis.
There were also multiple time frames with losses going out 2, 3, 4 and 5 years into the future.
Five years can feel like an eternity in the stock market.
The range of outcomes is also interesting to consider:
- Over a 5-year time horizon, returns ranged from -2% to 29% annualized.
- Over a 10-year time horizon, returns ranged from -1% to 17% annualized.
- Over a 15-year time horizon, returns ranged from 4% to 14% annualized.
The longer you invest, the odds of negative returns are reduced and the range of possible returns shrinks as well – meaning returns are more predictable.
Long-term investing removes a lot of variation from the equation.
Look at the returns in the bottom left — they’re all in a fairly tight range.
The 31-year annual return from 1993 through 2023 was around 10% per year, right at the long-term averages. Not bad!
This is despite some major, market-moving events in the last 30 years.
The Long-Term Capital Management fiasco, the Dot.Com bubble, 9/11, the housing bubble, the Great Financial Crisis, COVID-19, and the highest inflation spike in 40 years.
We also had a few recessions, two massive market crashes, two bear markets, and ten double-digit corrections.
And the stock market still returned 10% per year!
I don’t know what the returns will look like over the next three decades, but I am confident there will be plenty of risk, downturns, geopolitical crises, scary headlines and economic contractions.
Regardless of what returns the stock market produces in the future, thinking and acting for the long-term remains the best strategy for investors.