The Future is Volatile

Posted January 20, 2022
Chris Campbell
[Chris’ note: Yours truly is a bit under the weather this week, but the show must go on! Today, I present to you my colleague Bob Byrne’s assessment on the broader markets… what it means for stocks… and what it means for bitcoin and ethereum. By the way, this analysis from Bob is just a sneak peek of what you’ll find in Altucher’s Investment Network — a research service by James and team designed to keep you ahead of the curve in all things market movements. Many of our ALC readers are already members. Not yet a member? Click here to see if it’s right for you. And read on.]
The Future Looks Volatile
Bob Byrne
January 20, 2020 — That's when the CDC confirmed the first U.S. laboratory-confirmed case of Covid-19 in the U.S. from samples taken two days earlier in Washington state. And nearly every day since, something having to do with Covid, be it hospitalization or death rates, new variants, or government-imposed restrictions, has dominated the media.
But here we are, two years later, and the S&P 500 is 40% higher.
Think about that for a minute.
Industries like leisure, hospitality, and transportation were written off as dead and never coming back. Metropolitan areas like New York City, San Francisco, Las Vegas, and Orlando were toast. And the idea that we might reopen entertainment and sports venues was, well, you can forget about it!
Today, the Covid-19 Omicron variant is everywhere. Both my kids, 15 and 11 years old, recently had to take Covid tests to stay in school as part of the Utah school board's test-to-stay program. While my kids emerged unscathed, a ton of kids were sent home.
Away from Covid, we have soaring inflation, ineffectual leadership in Washington, and a Federal Reserve that's pulling back on its free money quantitative easing program and on the brink of ending its zero interest rate policy.
But again, even with this seemingly awful news, the S&P 500 remains within a whisker of all-time highs.
The Times They Are a-Changin'
Most investors don't realize that the S&P 500 gained nearly 29% in 2019, 16% in 2020, and almost 27% in 2021. Those are some impressive gains when you consider we're knee-deep in a pandemic and enduring the most substantial surge of inflation in decades!
Here's something else most investors don't realize — The S&P 500 typically experiences an intra-year pullback of around 17% during midterm election years. And we have a midterm election coming this November. Add in the uncertainty of upcoming Federal Reserve rate hikes, and I believe investors need to prepare themselves for a bout of volatility.
On the plus side, the return in the year following midterm elections, 2023 in this case, the S&P 500 has gained, on average since 1950, a whopping 32%. So, if you can stomach an increase in volatility and stay the course, the odds suggest you'll be rewarded handsomely in the not too distant future!
And as far as interest rates are concerned, while Wall Street typically panics about rates heading higher, over the past 40 years, the S&P 500 gains, on average, 7.5% during the six months following the first rate hike. Hardly secular bear market material!
The bottom line is while the prospect of higher interest rates and upcoming midterm elections is a recipe for downside volatility and possibly a short-lived cyclical bear market, history tells us to stay on the bullish course and be buyers into the weakness.
S&P 500 ETF (SPY)
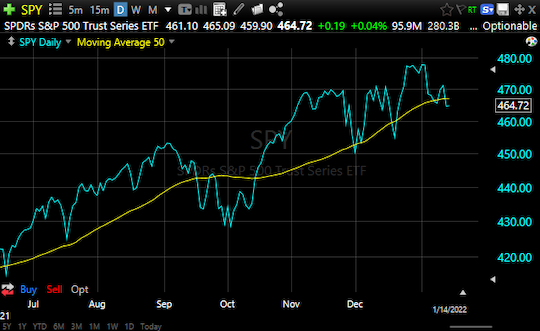
The mainstream financial media will tell you the S&P 500 ended 2021 less than 2% off all-time highs, and they’re right. However, while bank and energy stocks propelled the index to new highs, many technology, biotech, and resort and casino stocks were destroyed.
The truth is, 2021 was not a great year for all stocks.
While the S&P 500 index gained nearly 27%, many of the market’s fastest-growing companies saw their values cut by 25% to 50%. And with the Federal Reserve tightening its belt, interest rates set to rise, and midterm elections a mere ten months away, I believe the volatility that plagued the high tech sector in 2021 is about to infect the rest of the market over the next few months.
In November’s Market Movements, I pointed to the lack of natural sellers in the SPDRs S&P 500 Trust (SPY) above $470.50 and potential downside support near the 50 day moving average. While demand was thin above $470.50 and the push to new highs failed, dip buyers emerged against that 50-day moving average, around $450, right where they were supposed to.
Today’s set-up is neither clean nor pretty. The failed drive to new highs at the end of 2021 triggered another test of the 50-day moving average, only this time, the average has risen to $467. And unlike the successful test of that reference point in November, buyers are tough to find this time.
Barring a strong close above $471, traders need to be on the lookout for a quick flush toward the rising 200-day moving average, and that reference point sits around $441.
Nasdaq ETF (QQQ)
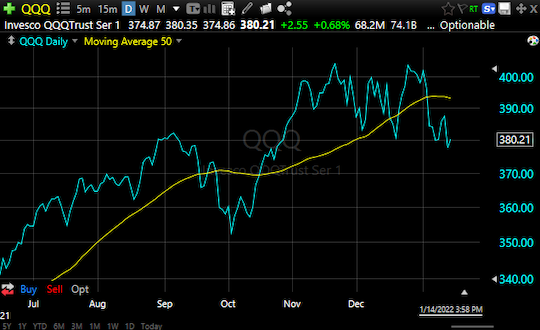
Calling a top in a market is nearly always a fool’s errand. That said, after the past two months of failed upside breaks, it’s impossible to look at the QQQ and not recognize that buyers are exhausted.
In November, I talked about how eight stocks determined nearly 50% of the performance of the QQQ. Unfortunately, while those eight stocks have performed relatively well, 40% of the remaining 94 stocks are already down at least 20% and in bear markets.
The best hope for the bulls is that the QQQ continues to trade in a sideways pattern, building momentum for an eventual push to new highs. But if you’re an active trader, rather than buy the QQQ here beneath the 50-day moving average, I’d opt to stay on the sidelines until the index is cleanly above $394 or bouncing from its 200-day moving average near $365.
One last thing to keep in mind...
Because the QQQ rarely bounces right from its 200-day moving average, if you’re a dip buyer, consider waiting for a price closer to the early October lows, around $350.
ARK Innovation ETF (ARKK)
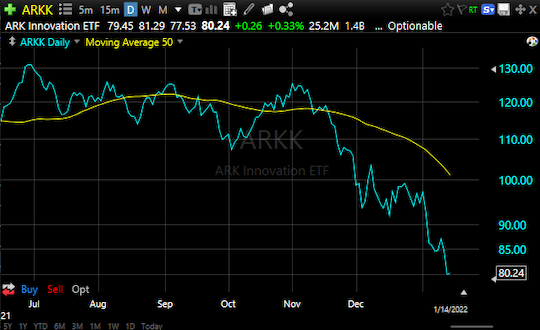
We’re talking above the ARK Innovation ETF (ARKK) when we talk about the destruction of high-growth tech stocks. Because while the ARKK is merely an ETF, it’s packed with many of today’s most innovative companies. Unfortunately, that innovation comes at a cost. And this market has no appetite for overpriced stocks!
The decline in shares of ARKK has been gut-wrenching to watch.
Part of the selling is because many names held in the ARKK ETF are, frankly, wildly overvalued. However, a large part of the selling is the market pricing in higher interest rates.
The silver lining to this selling is that a large part of the repricing will be behind us when rates rise. So, while I’m not interested in trading the ARKK for anything more than a short term trade, and certainly not until it closes above a 21-day exponential moving average, I believe the ETF and many of its holdings may be investable once we get closer to the day of the first rate hike.
For now, if you want to trade the ARKK on the long side, wait for it to close above a 21-day exponential moving average. But if you do invest in the ETF, don’t get greedy. A test of its declining 50-day moving average will likely attract a new batch of sellers.
Bitcoin (BTC)
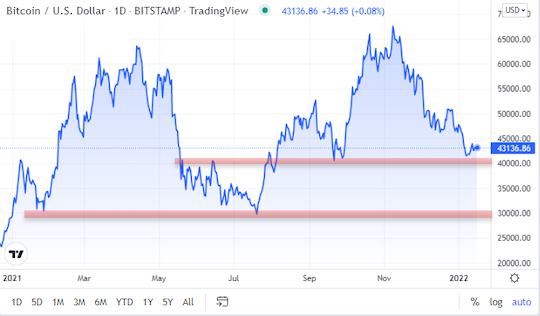
Many on Wall Street continue to believe that Bitcoin is akin to digital gold, or at least a hedge against inflation. And while that may turn out to be the case in the future, it’s not a reality today.
While Bitcoin is an alternative asset, it closely resembles an even more volatile version of a momentum stock. And that means continued pressure on the Nasdaq and the ARKK is likely to lead to continued selling in Bitcoin.
With Bitcoin currently trading between $42,000 and $43,000, the first level traders should be watching is $39,500 to $40,500. If that level breaks, there’s virtually no meaningful support until $30,000.
From a trading perspective, I’d consider placing initial bids around $40,000. But we all know how fast the crypto markets move. If bids are weak around $40,000, you better be ready for that quick flush toward $30,000.
Ethereum (ETH)
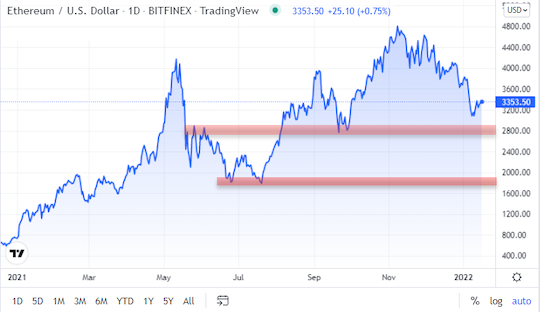
The chart of Ethereum isn’t all that different from Bitcoin. But given the rise in popularity of NFTs, I expect bid support and an ensuing bounce to favor ETH over BTC.
Similar to the lack of support in Bitcoin between $40,000 and $30,000, Ethereum has virtually no floor between $2,800 and $1,775.
Now, while I doubt sellers have the energy to knock $1,000 off the price of Ethereum, I do believe a breach of $2,800 could test $2,400 with relative ease.
From a longer-term standpoint, I love the idea of purchasing 2/3rds of a position around $2400, with the final third being reserved for a more significant correction toward $1,800.
Regards,
Bob Byrne
For Altucher Confidential