This Chart Looks Like Trash

Posted June 17, 2025
Chris Campbell
It looked like trash—until they touched it.
Back in 2013, a California couple was out walking their dog. Same trail they’d taken a hundred times.
Nothing special.
Then they saw it—just off the path. Half-buried. Rusted.
The kind of thing you’d mistake for an old soup can and keep walking.
But curiosity has a funny way of paying off.
They dug it up.
Inside they found old gold coins. Perfectly preserved. Some dated back to the 1800s. A few were so rare, collectors would later throw six-figure bids at them like confetti.
Here’s the part I love:
That night, instead of posting about it on Facebook, they reportedly pulled out old mining maps. 1800s parcel records. Hand-drawn surveyor sketches.
Maps nobody’s looked at in a hundred years.
They started cross-referencing everything—where the gold rush trails used to run. Where robbers, fugitives, or miners might’ve hidden something they didn’t want found.
Turns out, a pattern emerged.
They returned the next day with a metal detector, the map, and a theory.
And over the next few days, following the pattern, they unearthed seven more cans… each buried deeper, heavier than the last.
In total: 1,427 coins.
Face value? $27,000.
Collector value? Over $10 million.
That’s the power of maps.
Sure, they were lucky on the first can—the one that looked like trash. But the rest of the cans were way more than luck. They found those because they discovered a pattern.
And that’s exactly what our Paradigm colleague Mason Sexton does in the markets.
Only his maps and patterns aren’t drawn on old paper—they’re charted in cycles, patterns, and time.
This Chart Looks Like Trash
Take a look at this chart.
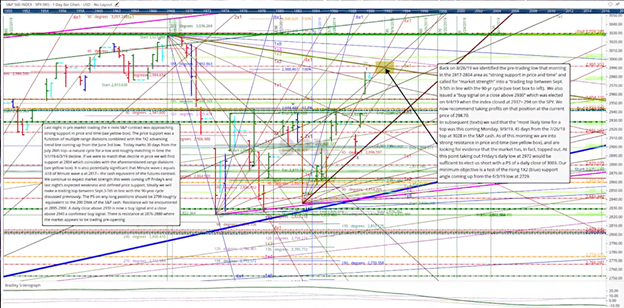
Most investors would scroll past it. Maybe delete it. Maybe laugh. It looks like trash.
A rusty can sitting off the beaten path.
But to Mason Sexton, it’s his “Map.”
The same map that’s guided him for over 40 years—across crashes, rallies, and chaos.
Like:
- 1987 – Black Monday
- 2008 – Global Financial Crisis
- 2020 – COVID Crash
Tomorrow, he’s agreed to a rare interview to talk all about it. And reveal why it points to another massive market-shaking event starting THIS WEEK.
(Mind you, he predicted this well before everything kicked off in the Mid-East. Which is eerie.)
The event happens Wednesday, June 18, at exactly 1:27 PM.
Why 1:27? That’s the moment the next “buried event” begins.
Not because Mason’s guessing—but because his decades-long tracking of cycles, alignments, and financial pivot points says it’s the start of something big.
He’s spotted them before. Each time, the map said dig.
And each time, most people walked right past it, deleted the email, threw the chart in the trash…
And missed out. Again.
I’ll admit. I don’t know exactly what he’s going to say. I’ll be listening alongside you. Are we standing over something and not seeing it? Are we walking by a can of old gold coins?
June 18. 1:27 PM.
That’s when we learn.